Hospital uses analytics to reduce energy usage
 |
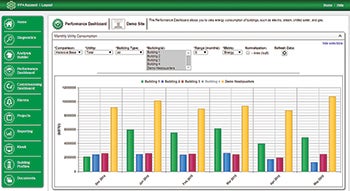
| GRAPHIC COURTESY OF SCHNEIDER ELECTRIC The dashboard is part of the software Elmhurst Memorial Hospital uses to provide energy-use data. |
Elmhurst (Ill.) Memorial Hospital is participating in a new utility program that makes data readily available so the hospital can take steps to cut energy use.
Elmhurst is among the first commercial customers of Chicago area utility company ComEd to participate in Green Button Connect My Data, which makes energy analytics available to the hospital through a partnership with Schneider Electric, Andover, Mass.
Elmhurst Memorial has saved more than 400,000 kWh in energy, which translates to about $20,000, since it began participating in the program in the spring. The hospital did not need to invest in hardware or software to participate.
To help customers maximize energy savings through Green Button, ComEd offers Energy Insights Online, a free Web-based energy analysis service that interfaces with the program.
The online service provides Elmhurst a detailed analysis of its energy usage by enabling Schneider to provide automated monitoring-based commissioning (aMBCx) technology that links to ComEd’s.
Using a Schneider Electric utility interface, data are pulled from different sources, including three on-site ComEd smart meters, with information Schneider compiles every five minutes from 13,000 sensor points within the hospital’s HVAC control system.
While Green Button provides data through ComEd’s smart meters, Schneider Electric’s Building Analytics software is monitoring data produced by 13,000 sensors in the hospital’s building automation system, he says.
Energy-saving actions taken by Elmhurst Memorial after getting data through the program are static pressure resets that led to reducing HVAC fan speeds, chiller condenser water temperature resets and economizer optimization, he says.
Other information the building analytics software can provide include:
- Real-time comparison to the previous year’s energy consumption in a building.
- Daily notifications of automated diagnostics indicating out-of-range building consumption, including statistics about energy usage relative to a baseline model.
- Automated diagnostic results for visibility into a facility’s most costly issues.
- Analysis to aggregate diagnostic results and track progress.
“There is a growing awareness about the value analytics can bring to energy managers to help improve energy performance,” says Greg Thompson, manager of Smart Grid offers at Schneider Electric.
Green Button was created with the support of the Department of Energy and structured so that third-party applications enable buildings to leverage utility energy data.


