Data-driven planning
 |
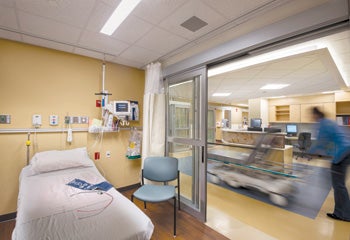
| Pre-op and recovery rooms provide an example of how the same space can accommodate two functions at different times of day. Photo by Joseph St. Pierre Photography |
Determining space needs can be the most critical step in any health facility design project. With rare exceptions, more space means more cost. And a lot more space can mean significantly more cost if it triggers major construction and disruption.
Moreover, too much space can mean inefficiency and increased travel. Long term, the space must be maintained, heated and cooled. Space programming is the first step in a process that is already on a tight schedule. Unfortunately, it is often undertaken with limited information.
Perfect opportunity
Projects typically start when a need is identified, a new service is introduced or an existing service needs to be better accommodated. Then, an internal review process is undertaken, administration buys in, and budgets and a schedule are established. The project builds momentum and those involved may overlook the crucial question, "Is the need driven by space issues or is it operational, or both?" Solving operational and capacity issues by adding more space is often the default solution. Add more rooms and the facility can accommodate more patients. Add more storage space and it can accommodate more supplies. Add another procedure room and it can treat more patients.
Often, space programs are developed by reference to guidelines, industry benchmarks, past experiences and rules of thumb. They are heavily influenced by the personal perception of the users and management. While few participants in the programming process consciously distort information, their perception of the environment often is colored by crisis situations. A typical example is when a surgical department experiences short periods of patient crowding in recovery spaces. The perception of staff is that more space is needed, not "we need to manage the schedule." It's far easier to add rooms than negotiate times with surgeons.
The end result can be programs and, in turn, projects that are not properly sized — often oversized, but just as importantly, sometimes undersized. There also is the risk that inefficient processes can become "institutionalized" by simply providing more space. An example is an emergency department (ED) that expands to address patient backlog and waiting without changing staffing or processes. Patients are still waiting, but in an expensive new ED treatment space. Administration can't understand why its expensive project didn't solve the backlog problem.
A new project is the perfect opportunity for health care institutions to consider both physical space and process improvements. In this period of dwindling resources for construction and capital expenses, project space needs should be developed in a more analytical manner. Utilizing a data- and process-driven approach helps to define projects that are cost-effective and efficient. A programming and design process that considers both physical space and process helps health care providers to avoid transferring inefficient processes to newly designed spaces.
Effective analysis
Data often can drive effective analysis. Fortunately, hospitals are awash with data. Most hospital software systems track time of day and duration of patient check-in, room occupancy, procedure time and other variables. This data can be mined to develop an accurate picture of what's really happening in a department and to validate or correct staff perception.
Data can inform the surgical department that reached crisis backup that it only happens for one hour on one day per week. The department that believes it is busy then can learn from data that its volume has plateaued or even dropped. Programmatically, this can be critical. Does a department really need to expand? Has there been a change in how care is delivered that actually reduces efficiency? There may be other reasons to expand a department, but the questions should be asked so an informed decision can be made.
Making sense of hospital data can be a complicated endeavor often involving the analysis of thousands of records. The goal is to distill data to understandable and useful information. An example is quantifying length of stay in an ED, where the duration may be as short as 15 minutes or as long as 15 hours. Averaging between the two is not accurate.
Patients are rarely consistent but data analysis often can predict results. This also can reveal attributes that are unique to a facility. A perfect example is the arrival trends for an ED. One might assume a peak arrival period starting in the afternoon. However, a review of patient arrival times can reveal a different picture, showing that it occurs early with less of a surge. The cause could be the demographics of a community with a high percentage of retirees. This informs both the program and design.
Data collection also can be simplified, based on observation or staff recording. The level of detail should be balanced with its intended use. It is hard to justify a major programming decision based on a limited sample. Clarification of an issue would be better informed with some data rather than none. Anecdotal data derived from interviews still can be useful when developing a concept. The results may provide justification for more study.
So, how does this vast trove of data help to determine space needs? There are multiple techniques that can utilize data to inform the programming design process. Simple histograms, charts and spreadsheets can coalesce a lot of data into an understandable picture. These can demonstrate trends, peaks or averages in areas such as space utilization, length of stay and volume.
Nontraditional tools
There are several nontraditional tools that can be used to analyze health care processes. Lean, Six Sigma and simulations are examples. Each has a role and value depending on when and how they are applied. Lean, also referred to as the "Toyota production method," is a hands-on methodology that seeks to achieve continuous improvement in operations and quality. Lean is based on staff and management training and a commitment to success. The term "Lean design" can be a misnomer if it implies that Lean is externally applied by designers.
A perfect example of Lean impact on a program is determining storage needs. Clinical settings are always seeking more storage, but the need is most likely the result of inefficient practices.
A departmental Lean initiative on storage can lead to significant reduction in area needs. Less area to be built not only saves construction costs, but also reduces inventory. More organized and compact storage facilitates staff access, improving care and the bottom line. Programmers can't assume a reduction in storage space based on work at other hospitals. While a reduction can be suggested, they must be confident that Lean improvement has taken place and is sustainable. If not, the likely result would be frustration and supplies left in hallways.
Six Sigma helps to define the potential for improvement and how to work toward achieving it. It is informed by data and requires a commitment from management and staff to achieve lasting results. The goal of Six Sigma is to understand and limit variation. Ultimately, it is to find the root cause of variability so it can be reduced. For instance, a surgical department might be struggling with patient throughput in an operating room (OR) suite. It is perceived that there are not enough rooms. A Six Sigma project might identify wide variation in room turnover times. It would then focus on reducing variation and reducing timing. While seemingly insignificant, this improvement could change the number of patients treated per day, thus reducing room need.
Simulation modeling
Discrete event simulation is a sophisticated software tool that virtually models operations as a sequence of events. The software, first developed for industrial applications, can model staffing requirements, interactions between patients and caregivers, lengths of stay, travel distances, utilization rates and waiting times, among other attributes. Depending on the detail of the model, virtually any process can be simulated.
Simulation models can be developed to test how changes in one area of the hospital may affect other areas. For instance, modeling the impact of "time to admit" on overall ED wait times can reveal how minor interactions can have big implications in a way that otherwise would be difficult to document. Because simulations are mathematical models, variables and variability can be defined to test options and reflect real life.
The first step is to create a baseline model of the current state to verify data and the understanding of flow and processes. This starts with flow diagrams to map out processes that may be hard to explain otherwise. It is a simple tool that helps the staff to communicate how they operate. Combining the flow diagram with data is the beginning of the simulation model. Flow diagrams by themselves are effective tools.
Once the baseline has been established, future-state models are developed to test the impact of new programs, changes to volume and process improvements. As a programming tool, simulation can define the need for key rooms. For instance, the simulation can be used to test the number of rooms needed for a department to accommodate census. Unlike static approaches, the simulation considers the impact of variability (i.e., what happens to a recovery area utilization when a few patients have longer-than-anticipated recovery times). The department then can assess a level of service needed. Is a wait of five minutes acceptable or is no wait under any condition a requirement? Decisions with significant cost implications can be made based on analysis.
Simulations provide an opportunity to explore sharing spaces between departments. This can demonstrate that departments with differing schedules can share spaces, resulting in less program area. An example is having two departments share pre-procedure space based on compatible patient arrivals. The simulation clearly can demonstrate room utilization and how the patients mix.
In addition to numerical results, simulation animation can create a movie of the future. Staff and patients can be seen moving through an unbuilt design. This provides staff an opportunity to visualize how their new department will function. It can be used to identify potential bottlenecks, travel distances and staffing requirements.
An analytical approach, such as simulation modeling, can help to justify a project. It can support the need with analysis, providing the evidence to support the case. This can be helpful during internal reviews with trustees and external reviews with regulatory authorities.
Using existing data is informative and relatively quick to assemble, but it represents historical information and may be based on existing inefficient processes. So, while changes to basic flow and processes can be modeled and tested, many influences are not considered. This is where the combination of Lean and Six Sigma helps to inform the analysis. A simulation can demonstrate the potential impact of a change in process, while Lean tools used by staff can test if it is feasible and sustainable. Trials of process change can be run quickly in a clinical setting to make sure the simulation assumptions are accurate.
Certainly, there are risks with this approach. This includes programming and designing around process change when there is limited buy-in. For instance, a user group may endorse a process change, but the program basis will be wrong if it is not fully adopted by the organization. A strong-willed manager may mandate a process change that drives the design, but is never implemented because he or she leaves. Administrators may have a vision for change, but fail to achieve staff and physician buy-in. When they occupy their new space, they likely will revert to their old ways of doing things and the space simply won't work. This is a classic underestimation of the power of culture.
Timing may be the biggest challenge when integrating process improvement into programming and design. A project may take years to reach approval to proceed. Once approved, it develops a life of its own, with expectations set, funds allocated, managers delegated and a schedule firmly defined. The team running the project is less concerned about process improvement than meeting schedules and budgets. The last thing it wants to hear is, "Why are we doing this?"
Basic tenets
A data approach to programming and design harkens back to the basic tenets of the scientific method — ask the question, research the issues, propose a hypothesis, test it and then reach an informed conclusion.
As more health care institutions become proactive participants in process improvement, architects, administrators and clinicians can be confident that they are defining projects based on best practices.
Steve Clayman, AIA, ACHA, is a vice president with Lavallee Brensinger Architects and is the founder of Optimal-Use, a health care process-analysis consulting group, both of which are based in the greater Boston area. He can be reached at steve.clayman@lbpa.com.
Building a case for a rapid-assessment project
 Clinicians in charge of a hospital emergency department (ED) recently sought to improve and streamline care by eliminating triage and adopting a rapid-assessment zone (RAZ). They hoped this change would reduce long waits for care and reduce the incidence of patients' leaving without being seen.
They needed to test their hypothesis to provide justification for the process change and associated project cost. So, a consulting firm was hired to work closely with nurses, doctors and quality assurance professionals to define the current state and the proposed future state. Several months of patient records were analyzed to define ranges and variability for patient volume, arrivals, lengths of stay and acuity levels.
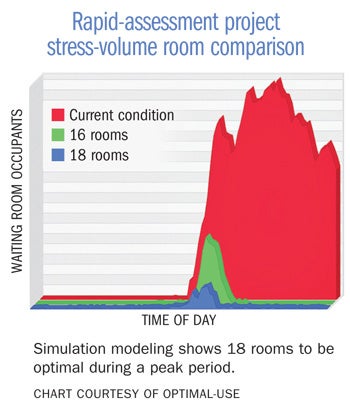
A discrete event simulation was first developed of the existing conditions. This validated the accuracy of the model and the data. It also formed a basis for improvement. The metric for performance was the number of patients in the waiting rooms. A model based on the proposed RAZ concept then was developed.
Simulation modeling can be used as part of an interactive design process. By incorporating user-defined variables, it is possible to test various scenarios quickly with the impact of changes immediately understood. In this case, the number of RAZ positions could be changed easily to test how waiting was impacted.
Modifying the percentage of patient acuity types utilizing the RAZ unit had a significant impact on throughput. Once a program was finalized, it was stressed to test increased volumes and compressed patient arrival times. This demonstrated that, although 16 RAZ rooms would work under most conditions, 18 rooms could dramatically reduce backups during a peak period. Because of the existing space constraints, determining the optimal number of rooms was critical.
The results informed the design and ultimately the budget. The clinicians in charge of the ED now could present their case to administration justified by analysis.
Utilizing data analysis to prove the benefits of a design
 Private doctors' offices often have been sacred cows when it comes to designing out inefficiencies. The evolution of primary care toward collaborative teams has begun to challenge this perception, but it has not always been an easy transition.
To prove the benefits of a team room concept, a design firm utilized simulation to inform both the design and ultimately the caregivers. The project was a large primary practice based on a medical home model. The design proposed team rooms located within pods of exam rooms. This placed the clinical staff close to one another and their exam rooms.
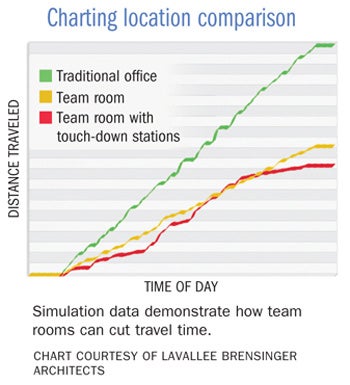
To maximize contiguous clinical spaces, physician offices were to be located on another floor. Not unexpectedly, there was some serious push-back. To prove the benefits of the proposed design, the design firm developed a model that simulated where physicians did their documentation during the course of a day. The model incorporated three possible locations — a traditional doctor's office at the end of a group of exam rooms, distributed team rooms and touch-down stations in halls.
The simulation model demonstrated that practitioners would spend 50 percent less time walking during the course of a day in a team room scenario compared with traditional offices. This could be further improved by another 10 percent if they occasionally used touch-down positions between exam rooms.
The analysis assumed that some percentage of documentation occurred during the course of an exam. By offering these results, the physicians became more comfortable with the design direction. Further, the added cost of the touch-down stations was justified easily.
While one could have assumed that the proposed design would improve efficiency, this approach provided factual evidence.


