Studying airflow in the OR

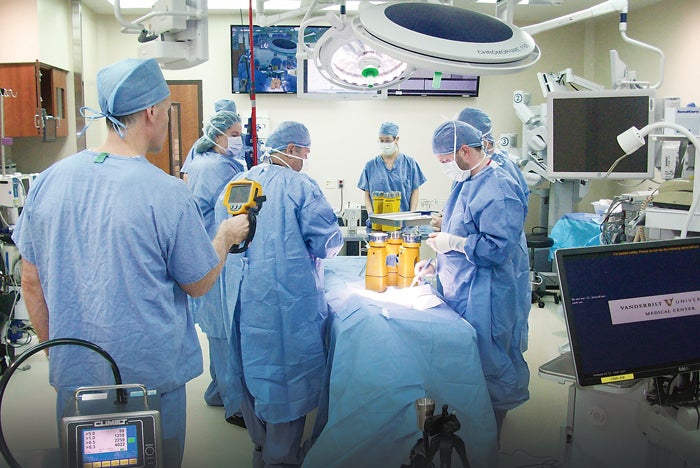
A multidisciplinary team conducts a mock surgical procedure as part of a project to measure environmental quality indicators.
Many steps are taken to provide a clean environment in operating rooms (ORs) in an attempt to prevent surgical-site infections (SSIs). From a clinical standpoint, these include scrubbing and gowning, special cleaning procedures and strict protocols for movements in the sterile field. From a built environment standpoint, these include washable surfaces, controlled access and a tightly controlled range for temperature, pressure, relative humidity and ventilation rates.
Due to variations in state building codes, 15 or 20 air changes per hour (ACH) may be the minimum required. However, in practice, most hospitals operate at 20 to 25 ACH with some using up to 40 ACH. These rates are all up from 12 ACH, which was the requirement for many years. By comparison, the requirement for patient rooms is 6 ACH.
Do the higher ventilation or air-change rates actually provide a cleaner environment and possibly reduce the risk of surgical-site infections? This is the question that a multidisciplinary group undertook to research at several hospital sites in a study partially funded by the American Society for Healthcare Engineering (ASHE). The team included a board-certified surgeon, a microbiologist specializing in infection control, an industrial hygienist, a mechanical engineer and an environmental engineer all with health care experience.
Researching the problem
As the team completed a literature review on the topic, several studies were found that tested the indoor environment in a static or empty OR or even in a laboratory. The National Institutes of Health have completed several good studies that demonstrate room-contamination levels and how they respond to air distribution using computational fluid dynamics. The team also discovered several studies that linked air quality to SSIs. While there were differing opinions on the percentage of SSIs that could be linked directly to airborne transmission, there was clear consensus that airborne contaminants can cause infections.
Based on these published studies, the team felt that research in an actual hospital setting with dynamic operating conditions would be the most accurate method to measure and understand the impact of different air-change rates on air quality in ORs. The quality data then could be compared to the estimated cost of providing these large quantities of filtered, conditioned air to provide a cost-benefit analysis for different air-change rates.
To more closely simulate hospital conditions, the team decided that testing the effectiveness of different air-change rates would be accomplished best during a simulated surgical procedure in an existing OR to replicate actual conditions. Given the current codes and practices, the team chose to test the previous Facility Guidelines Institute (FGI) requirements of 15 ACH, the current code of 20 ACH and current practice at many facilities of 25 ACH.
The hypothesis was that 20 ACH would be cleaner than 15 ACH and 25 ACH would be cleaner than 20 ACH. Three sites were chosen to test the hypothesis: a children’s hospital, an adult academic medical center and a general OR at a community hospital.
ASHE Resource |
| Methodology for Analyzing Environmental Quality Indicators |
|
|
Due to patient privacy issues, ethical considerations and the risks of testing during an actual surgical procedure, the team developed a mock surgical procedure that simulated the steps with a real surgery without the patient. A steak from a local grocery store was used to simulate the cutting and electrocautery of a patient. The team’s surgeon helped to develop a “script” for a realistic one-hour procedure that defined the steps for each member of the surgical team in four-minute increments.
A team of seven individuals played dual roles: to help gather particulate, microbial and room data while in position and moving as surgical team members would in a typical surgical procedure. The members consisted of a chief surgeon, assistant surgeon, scrub technician, anesthesiologist, nurse anesthesiologist, circulating nurse and surgical resident. The scrub-team members, who were located at the surgical field, scrubbed, gowned and passed sterile instruments.
All members followed Association of periOperative Registered Nurses and American College of Surgeons recommendations for attire including foot covers, clean scrubs, head covers, gloves and masks. The team had staff walk out of the room to get an instrument to simulate actual surgeries. The surgeon adjusted the surgical lights and used an electrocauterization tool as he would in real cases. He led the mock surgery so that it was as realistic as possible, other than that his mock patient was a steak.
The FGI’s 2014 Guidelines for Design and Construction of Hospitals and Guidelines for Design and Construction of Outpatient Facilities, through American National Standards Institute/ASHRAE/ASHE Standard 170, Ventilation of Health Care Facilities, and other state codes define the key requirements for the HVAC systems in ORs such as temperature, relative humidity, pressure relationships, face velocity at the grilles and air-change rates.
However, there is no national standard for measuring the number of particles nor the number of colony-forming units (CFUs) in ORs. CFUs are the industrial standard unit of measurement for microbial contamination levels as measured by passive settling or active impacting of agar plates.
Testing protocol
Particulate counts and CFUs are the key indicators of the environmental quality of a space utilized in other critical environment industries. Examples include pharmacy compounding as defined by the United States Pharmacopeia Standard 797, Pharmaceutical Compounding — Sterile Preparations.
Particle counting in the microprocessing-chip manufacturing industry utilizes the International Organization for Standardization (ISO) Standard 14644. This classifies room-contamination levels on a logarithmic scale (each level has 10x more particles per cubic meter) ranging from an ultraclean room, ISO Class 1, to typical office space, ISO Class 9. The team adapted these standardized procedures along with ASHRAE Standard 170 to develop a more comprehensive method of testing for OR air qualities. The team developed a process known as the Environmental Quality Indicators (EQI) testing protocol.
For the particle counting, the team’s industrial hygienist utilized nine uniform sampling locations inside the room based on the square footage and measured particle sizes of 0.3, 0.5, 1.0 and 5.0 microns. Airborne particle counts were measured using a 75-liter-per-minute counter. To measure the microbial contamination levels in CFUs, the team used viable surface-air samplers.
Three samplers were placed at both the surgical operating field and at the back instrument table to detect airborne microbial contaminants.
Petri agar plates with tryptic soy agar media were used in the samplers and were changed in regular cycles to collect microbial data during the entire mock procedure. Bacterial genus and species were identified and quantified as CFUs per cubic meter. Several distinct species were identified by the independent laboratory including human-derived Micrococcus, coagulase-negative and coagulase-positive Staphylococcus as well as environmentally derived Bacillus, Corynebacterium, Acinetobacter and Pseudomonas, among others. Although species of these genera and others may be common human flora and are ubiquitous in the environment, they are opportunistic pathogens that could pose a health risk to immunocompromised patients.
In addition to these measurements, the team was interested in the air movement and velocities at critical points in the room.
The team placed anemometers 6 inches below one of the supply diffusers above the table, 6 inches above the surgical table (directly below the supply-diffuser sensor), at the corner of the back instrument table and at one of the room’s corner return grilles. This provided data on airflow in feet per minute so the team could understand the movement of the clean and conditioned air in the room. The thought was that better air management might be better than just more air.
Procedure results
The team has now completed more than 30 mock surgical procedures utilizing the EQI protocol to test air-change rates, surgical or machine generated smoke dissipation, clinical practices, surgical attire, medical equipment and sterile products. The results have been consistent and repeatable with some interesting findings.

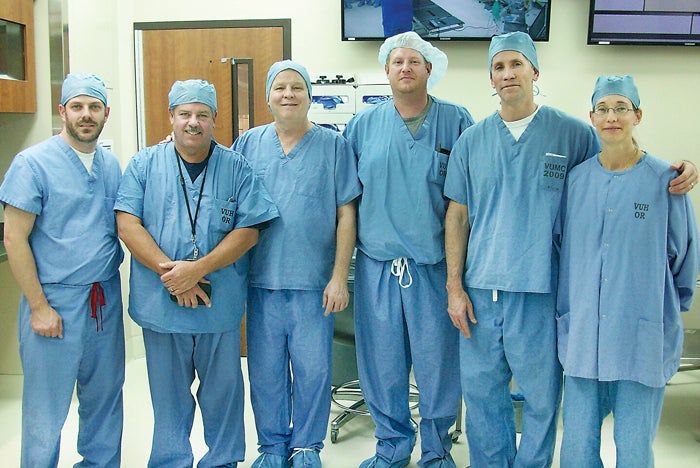
The Research Team: Team members included (from left) Troy A Markel, M.D.; a scrub technician; Thomas Gormley, Ph.D.; John Ostojic, industrial hygienist; Damon Greeley, PE; and Jennifer Wagner, Ph.D.
All of the OR’s dynamic testing results have fallen within the ISO 7 or 8 category. In spite of these overall consistent results, the team documented significant variations in the number of particles measured at times when the electrocautery device was used on the steak. The particle counters would register 1 to 2 magnitudes higher at the sampling locations when surgical smoke was being generated.
A troubling finding was that the air velocity at the back table was consistently low. The readings were 25- to 30-feet per minute (fpm) at the supply diffuser and 40 to 45 fpm at the sterile field, but an average of only 5 to 10 fpm at the back table. This means that the sterile instruments, which are often exposed to the room environment for extended periods, are not being bathed in filtered, conditioned air as is the case with the sterile field. This could lead to contaminants falling on the instruments to be used in surgery.
The configuration of the supply diffusers also contributed to the velocity and corresponding microbial contaminant levels at the back table. In ORs where the diffusers were concentrated above the surgical table, the system did not distribute air over the back table. Conversely, where the diffusers were more distributed and had a supply diffuser located near the back-table location, it correlated to higher back-table velocities and lower contaminant levels.
Overall, the team found that 20 ACH had statistically significantly fewer particles and CFUs than 15 ACH. However, for the most part, 25 ACH did not provide significantly cleaner air than 20 ACH. For particles, one OR showed no statistical difference among 15, 20 or 25 ACH at all particle sizes, while another OR showed significantly cleaner air at 20 than at either 15 or 25. There was an isolated case with the more dispersed diffusers in which 25 ACH produced more particles than lower ventilation rates. The team could not confirm the cause of this phenomenon, but have seen other research indicating that higher ventilation rates can cause or “stir up” more airborne particles.
Cost considerations
On the cost side, the team found that on average over multiple sites, an additional five ACH costs approximately $5,000 to $10,000 per year per OR. One hospital system reduced its average room air changes by five and, given its many ORs and current utility rates needed to heat, cool, dehumidify, humidify and reheat the air, saved more than $1 million annually.
Based on the team’s research and the positive interest it has received, several observations have been developed. There is a need for more evidence-based information to evaluate hospital practices, codes and products. Testing in real hospital conditions provides more accurate data and evidence. The use of an interdisciplinary team that includes clinicians, infection control experts and hospital engineers provides a more comprehensive approach to solving facility-related operational challenges.
There also is a need for more funding to research hospital and engineering practices and codes as many are based on historical or procedural approaches rather than actual research-based data. Often a “more is better” approach is used in the sincere effort to reduce risks in hospitals.
Finally, this research does not measure the impact of air-change rates in SSIs. While there is much research surrounding the OR airborne environment and basic logic says that cleaner air will result in fewer SSIs, there are so many factors than can impact SSI rates that it is difficult, if not impossible, to make a direct connection.
The reported SSIs per year are estimated to carry significant financial costs. In addition to this financial toll is the human suffering caused by these health care-associated infections.
While every effort must be made to minimize SSIs, there is limited health care funding that must be balanced with the increasing cost of health care and the growing demand as the baby boomers reach peak usage times.
Cost-effective solutions
Through collaboration and hospital-based research, clinicians, designers and facility managers can develop the most cost-effective solutions from both a patient outcome and financial perspective.
This study’s topic was air changes in ORs, but that is just one of many challenging questions related to the health care built environment that would benefit from more research-driven data. Additional study is needed to explore the link between OR air quality and SSI rates, so that more of the codes and practices can be based on research-based scientific data.
For now, the EQI protocol will provide the field with a comprehensive and effective tool to optimize sterile environments and to find out what is really happening in an OR.
Thomas Gormley, Ph.D., LEED AP, CHC, is associate professor at Middle Tennessee State University in Murfreesboro and a member of the committee that writes the FGI Guidelines; and Jennifer Wagner, Ph.D., CIC, is managing partner of Onsite LLC, and president and lead scientist of Prism Environmental Health & Safety Inc. in Discovery Bay, Calif. They can be reached at Thomas.Gormley@mtsu.edu and jwagner@prismehs.com.


